ABC Analysis, Pareto and Lorenz
We often discuss the ABC-Analysis with our customers in the context of various analytical projects. But not all the partners know that the well-known “Pareto principle” and “Lorenz curve of income distribution” build up the foundation for this kind of analysis.
ABC Analysis is method that allows you to classify the customers or resources of the company according to their importance and profitability. ABC analysis divides goods into three categories: A - most valuable, B - intermediate, and C - least valuable. In essence, ABC analysis is a ranking of the assortment according to various parameters. Suppliers, customers, stocks - everything that has enough statistical data can also be classified in this way. The result is a grouping of objects on the degree of influence on the overall result.
The calculation of ABC categories is usually based on the Pareto principle. The Pareto principle states that in most cases approximately 80% of outcomes are generated by 20% of activities. The principle was formulated by the Italian sociologist and economist Vilfredo Pareto, who showed that about 80% of the land in Italy is owned by 20% of the population. Later, the Pareto principle became one of the fundamental rules of business: 20% of customers provide 80% of the profits, 20% of employees do 80% of the work, etc.
Moreover, ABC analysis is also based on the principle of imbalance. When it is performed, a graph of the dependence of the total effect on the number of elements considered is plotted. It is called the Lorenz curve. The Lorenz curve is an alternative graphical way of representing the distribution function of a random variable. It was proposed by the American economist Max Otto Lorenz as an indicator of income inequality in the population. The X-axis shows the proportion of the population, and the Y-axis shows the proportion of income in society as a percentage. There is always inequality in the distribution of income in society, which is reflected in the Lorenz curve.
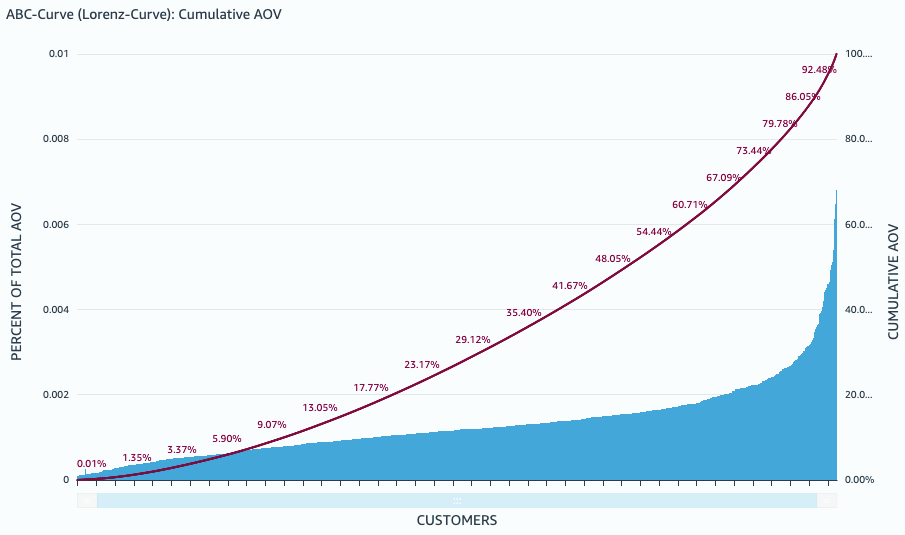
Below you see an example of a Lorenz curve created in one of our projects. In this case, we show the proportion of customers (X-axis) and their contribution to the cumulative AOV (Y-axis). According to this distribution, the whole set of customers is split into A, B and C categories. These categories are further used for concrete marketing campaigns and proper targeting of customer segments.