RFM Analysis – Customer Segmentation by Loyalty
Customer data can be divided into two categories: demographic (age, income, marital status) and behavioral. As a rule, marketing attempts to predict the customer behavior. The information that the customer has recently purchased several items with a total value of 2000 euros plays a much greater role than demographic information.
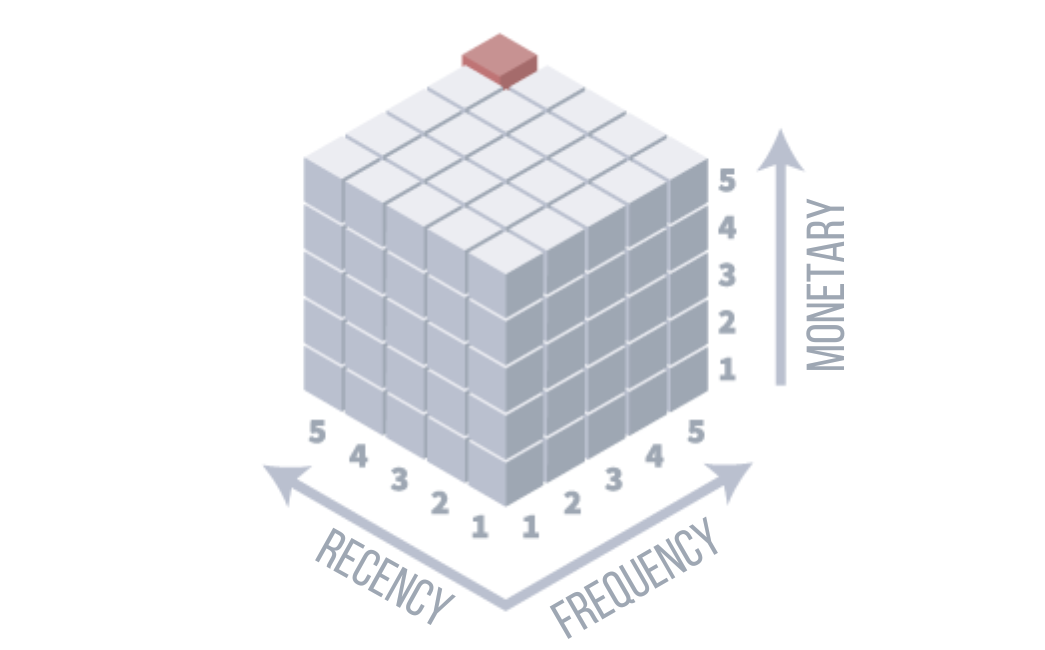
Direct marketers typically use RFM analysis to formalize customer value. For this purpose, three indicators are examined.
- Recency - the time dimension of the sale (how much time has passed since the customer's last purchase)
- Frequency - the periodicity of the purchases (the number of purchases in the period)
- Monetary - the total amount of sales (sometimes an average order is used)
Selection of the third indicator
The third indicator (monetary) can also be chosen differently if it corresponds to the main indicators recency and frequency. For an information portal, for example, the time spent on the page can be used as the third indicator.
The indicators frequency and monetary are often related: the more purchases, the higher the total amount. For this reason, in practice there is a simplified version of RFM analysis called RF segmentation. In this case, the monetary indicator is not used. Using this analysis, it is easy to determine which customers you need to actively work with and develop special offers.
The percentage of customers who respond to general promotional offers is usually low. RFM analysis is a simple as well as efficient method that allows you to predict a customer's reaction. In this way, you can improve the interaction with customers. Depending on the RFM segment, different methods can be used to influence customers. The most important indicator is recency, followed by frequency and finally the amount of sales.
Example usage of RFM on a private customer database
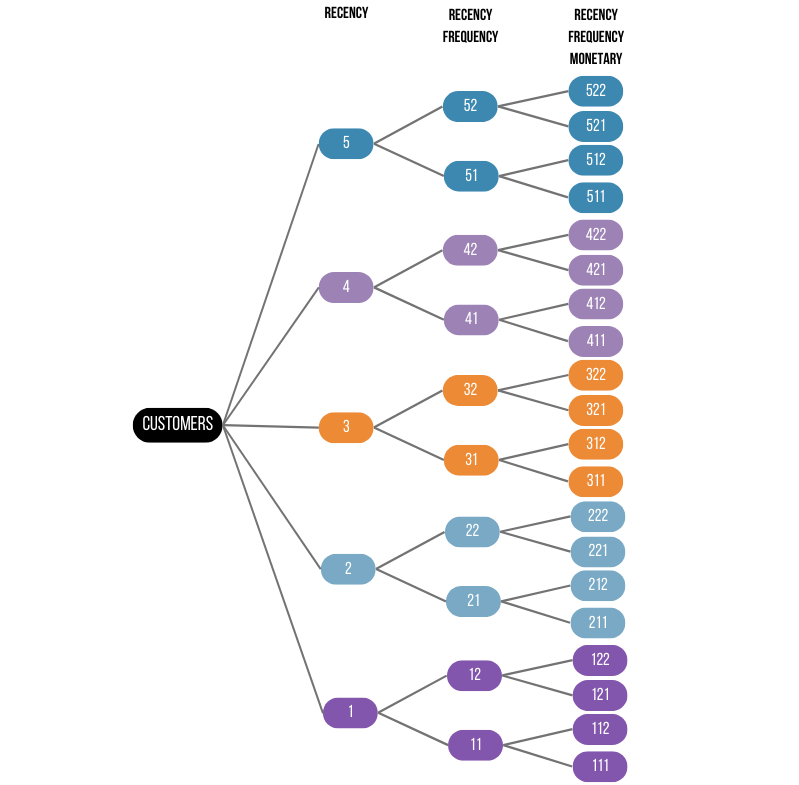
A small company selling textbooks sent letters to all its customers suggesting a purchase of the company's products. The cost of mailing was 85 cents per letter, while the profit from each sale was 28 euros. Therefore, to justify the cost of mailing the letters, the company had to receive more than 3% of the responses. For several years, however, the response rate was less than 1.6%, which yielded no profit. RFM analysis was used to divide the entire existing customer database into 125 groups (5x5x5). For each of these groups, the response rate was determined. Later, the company started to conduct mailings only within the groups that had a response rate above 3%, so it could finally make a profit.
It is important to note that the company will not profit from the continuous use of RFM analysis. It could be used to answer the question of which customer to write to or call. In this case, some customers will not hear from the company at all. Other customers, who are the most active responders, will be tired of the constant attention because they are contacted too often. A contact strategy must be developed as to what type of offer can be made to the less receptive customers. These customers need to know that the company has not forgotten about them.
Example usage of RFM on a corporate customer database
Let's consider the application of RFM analysis to a database of corporate customers. This type of database is, in most cases, much smaller than a database consisting of private customers. So you can reduce the number of groups. For example, in a database of 10000 records, 125 RFM analysis groups contain only 80 records per group. This is not enough to get statistical results. Let's reduce the number of RFM cells to 20 with a reduced number of groups sorted by frequency and amount of sales. For example, 5 by purchase date (recency), 2 by frequency, and 2 by revenue (monetary).
Limitations of RFM analysis
The theory of RFM analysis assumes a very simple mechanism for dividing recency, frequency, and amount of sales by segment. You sort all customers, and divide them into 5 equal groups for each indicator. This method is productive and helps to divide all customers into segments in relation to each other.
However, in practice there is a problem because these indicators change over time.
Example 1:
Business is going well, but suddenly not a single purchase is made for a month. This is bad, but if you divide the database into equal parts, nothing will change. For example, the recency segments will be the same compared to the previous month.
Example 2:
The new company does not yet have sales data for several years. In this case, the limits of recency will be very different every day and it does not make sense to use the result of such RFM analysis.
Seasonal patterns, promotions and holidays also have a strong impact on the quality of the analyzed data. Therefore, you should determine an appropriate time. To determine the time intervals, it is worth answering a number of questions:
- How long is the life cycle of a customer?
- What is the natural buying period?
- What is the seasonal pattern?
- How long does it take for customers to repeat a purchase?
The efficiency of RFM analysis does not mean that it can completely replace the sales manager. Personal communication with the customer allows the employee to understand them well and know a lot about them. The right way is to focus the manager's attention on the most important customers and work with the rest of them through email, messages and social networks. In this case, RFM analysis becomes an excellent tool for customer segmentation.


